Tips and tricks for your Kotlin code explorations
This blog post accompanies a video from our YouTube series which you can find on our Kotlin YouTube channel, or watch here directly!
We’re going to take a look at some handy tips and tricks to help you explore Kotlin code, no matter whether it’s your own code or the code from the Kotlin standard library or any of your other dependencies. They will equip you to discover some of the goodies in the code you’re working with on your own.
Working with Kotlin means we have some powerful companions by our side - IntelliJ IDEA and Android Studio - that help us in every step of the development process. Let’s get to know them a little better and become more productive!
Reading and writing code
So – how do I read and understand Kotlin code that I encounter and modify?
Annotating code with types and names: Inlay hints
A big helper I rely on every day is these little grey bobbles wherever variable names or types appear, called inlay hints, and honestly, I don’t want to read code without them. They give us information about types and parameter names, right where that information is most useful.
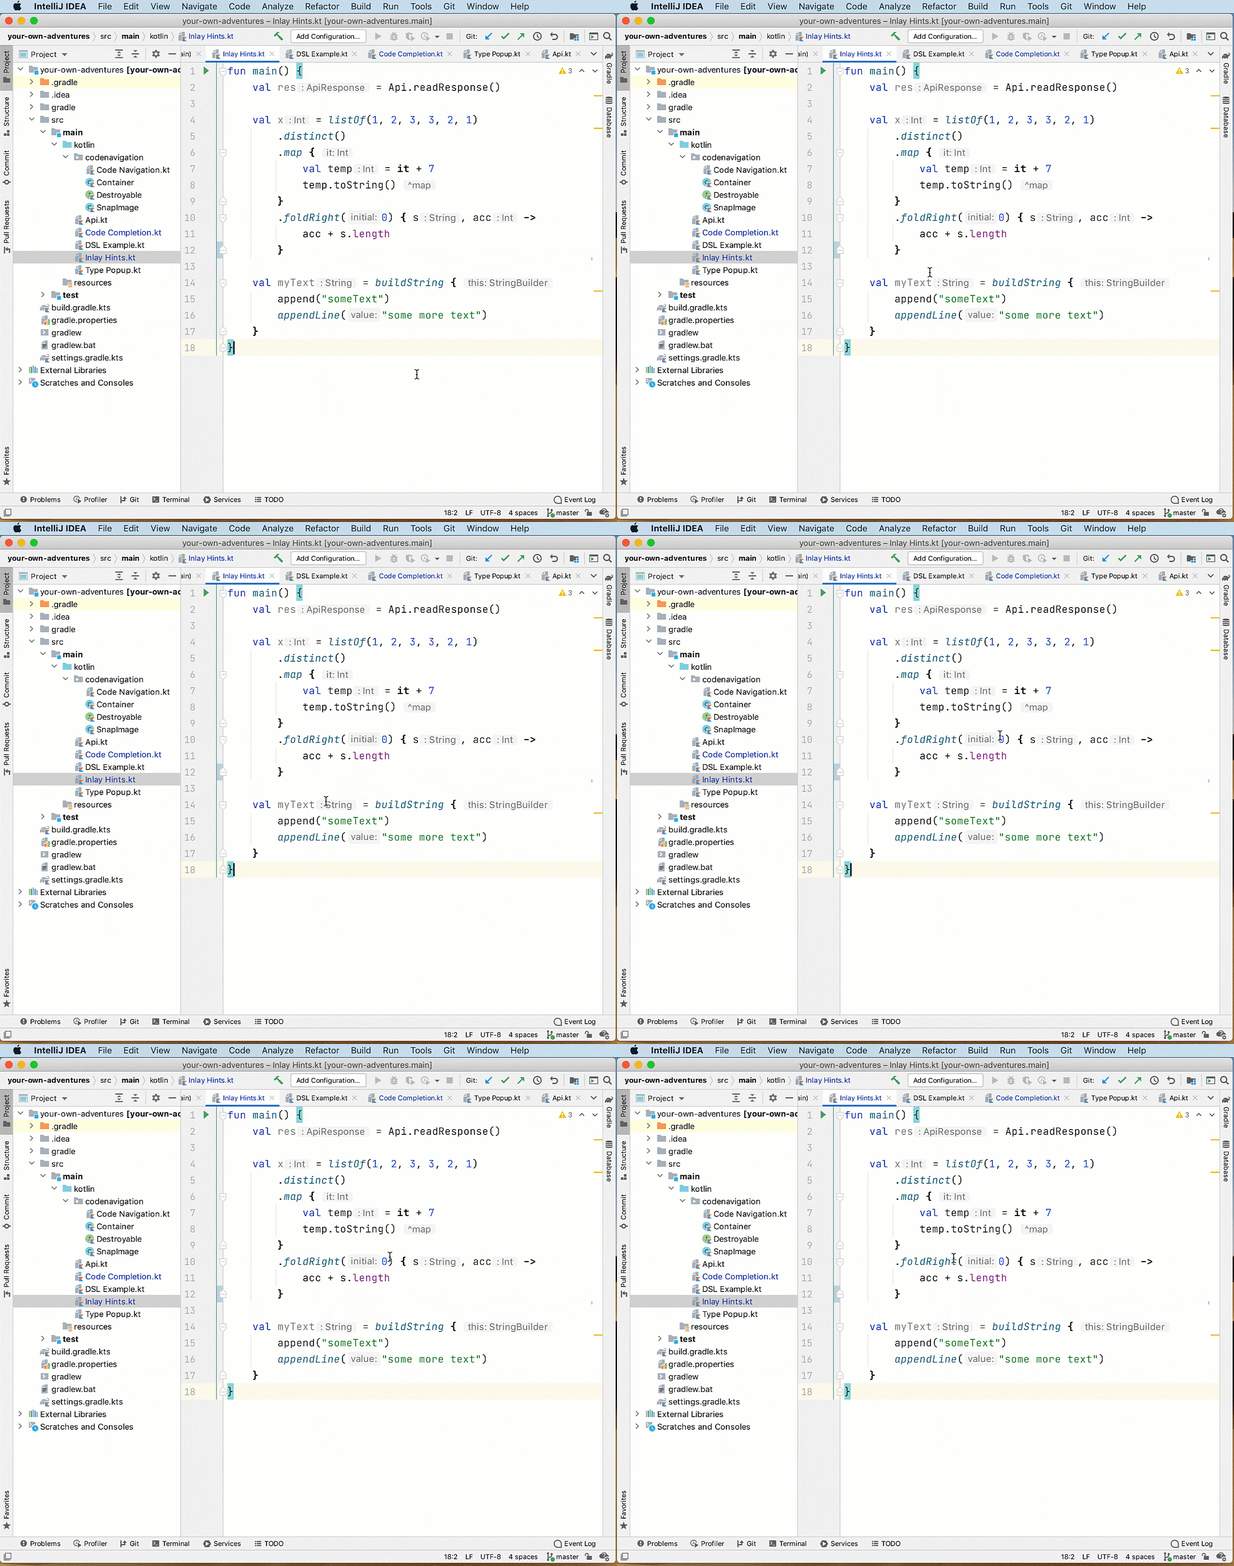
We enable those in our preferences under Editor > Inlay Hints > Kotlin. (I have all of them enabled, but toggles are available for fine-grained control.)
Inlay hints for chained operations
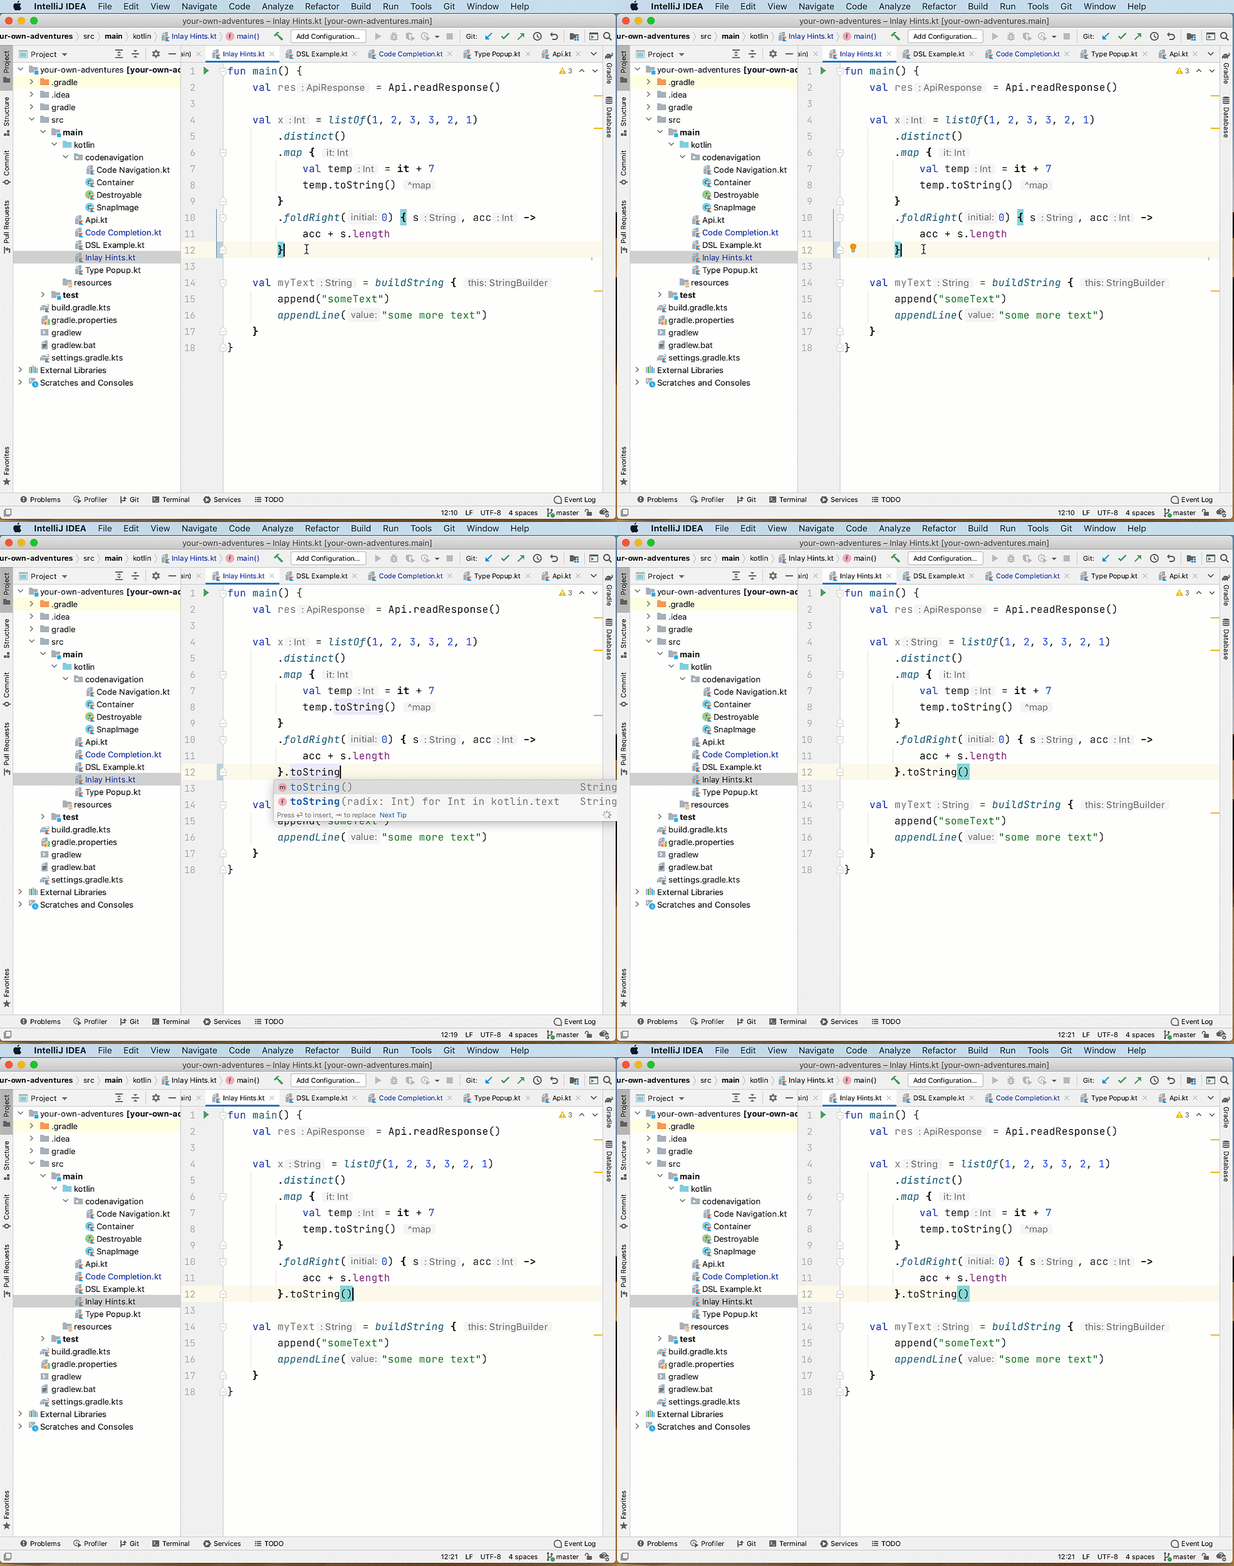
These inlay hints help me a lot! For example, when I’m chaining a bunch of operations, they give me a quick check whether I am creating the correct type at the end:
Inlay hints for lambdas and DSLs
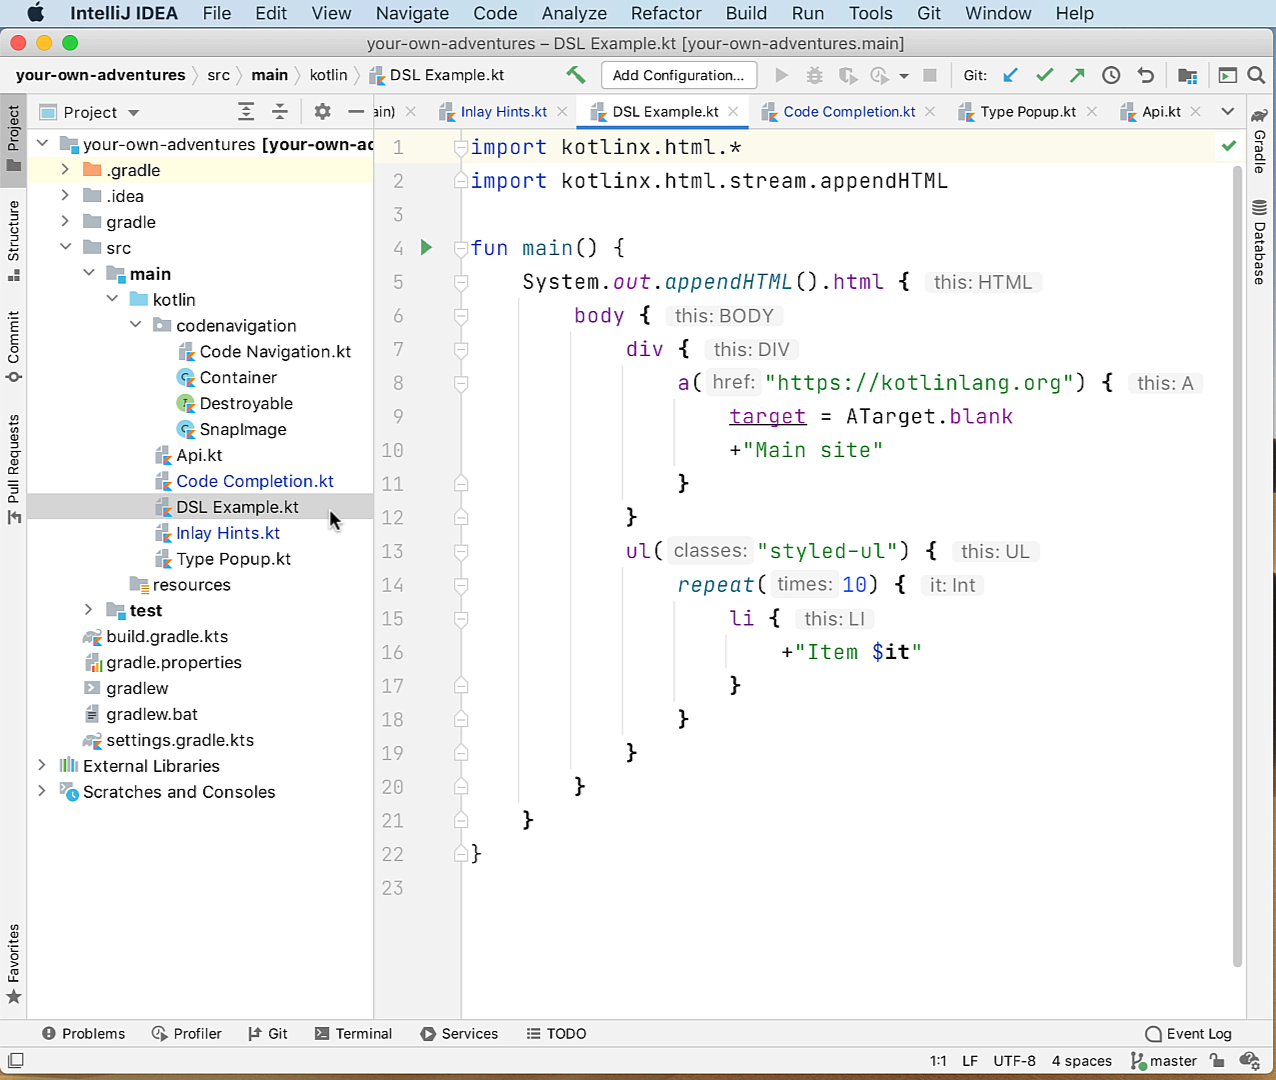
Inlay hints are also awesome whenever we encounter lambdas, especially lambdas with receivers, because they give us information about variables that are implicitly in scope, or which receiver your lambda actually provides.
Especially if we are working on a project that makes heavy use of Kotlin’s DSL functionality, these hints can help demystify some of these APIs:
Inlay hints for the Kotlin Gradle DSL
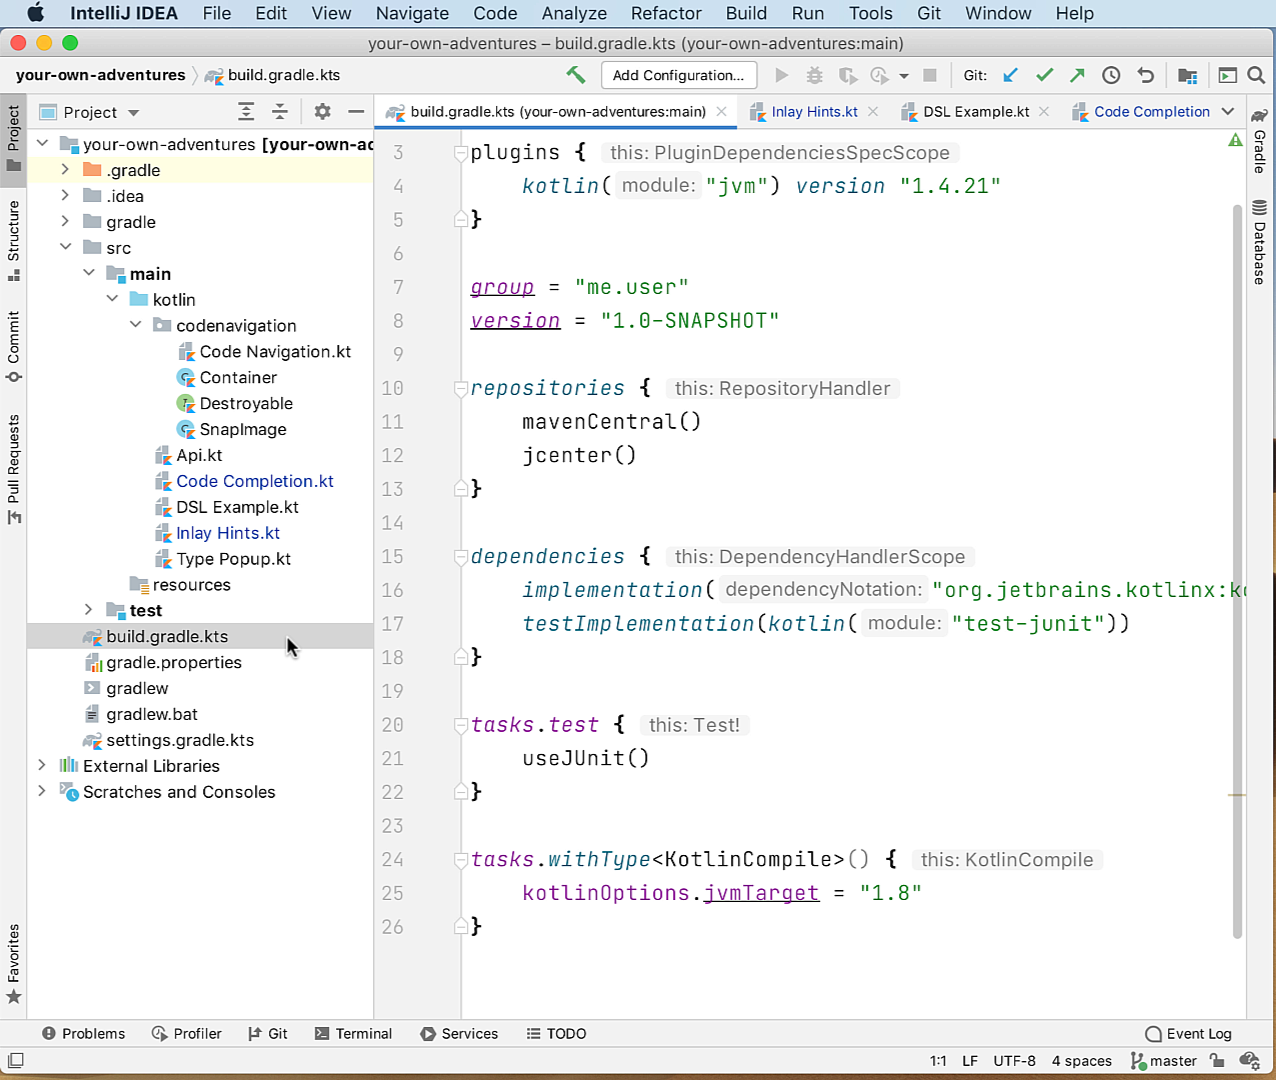
Oh, and as a little hint – if we are using the Gradle Kotlin DSL (so if our build file ends in .kts), these inlay hints also work here!
For someone who tried to avoid touching Gradle for quite a while myself, I’d say that the Kotlin Gradle DSL, together with these inlay hints, have helped me understand how the Kotlin DSL for Gradle works, what functionality is available in what scope, and so on:
Try using inlay hints yourself! Maybe you’ll fall in love just like I did.
Code completion (⌃ Space)
In my opinion, code completion is the number one way in IntelliJ IDEA or Android Studio to discover a Kotlin API. We know the drill – we put a dot behind a symbol, and get some suggestions of what we might want to call:

But code completion doesn’t always pop up naturally. For example, when you’re inside a lambda function. Via inlay hints, we might be able to determine that there’s an implicit this in scope – and we could type this. and get code completion. But there’s also a nicer (and easier) way.
We just press ⌃ Space (Ctrl Space on Win/Linux) to manually invoke completion based on our current scope. And this works practically everywhere – whether we are inside a builder block or returning to an unfinished statement.
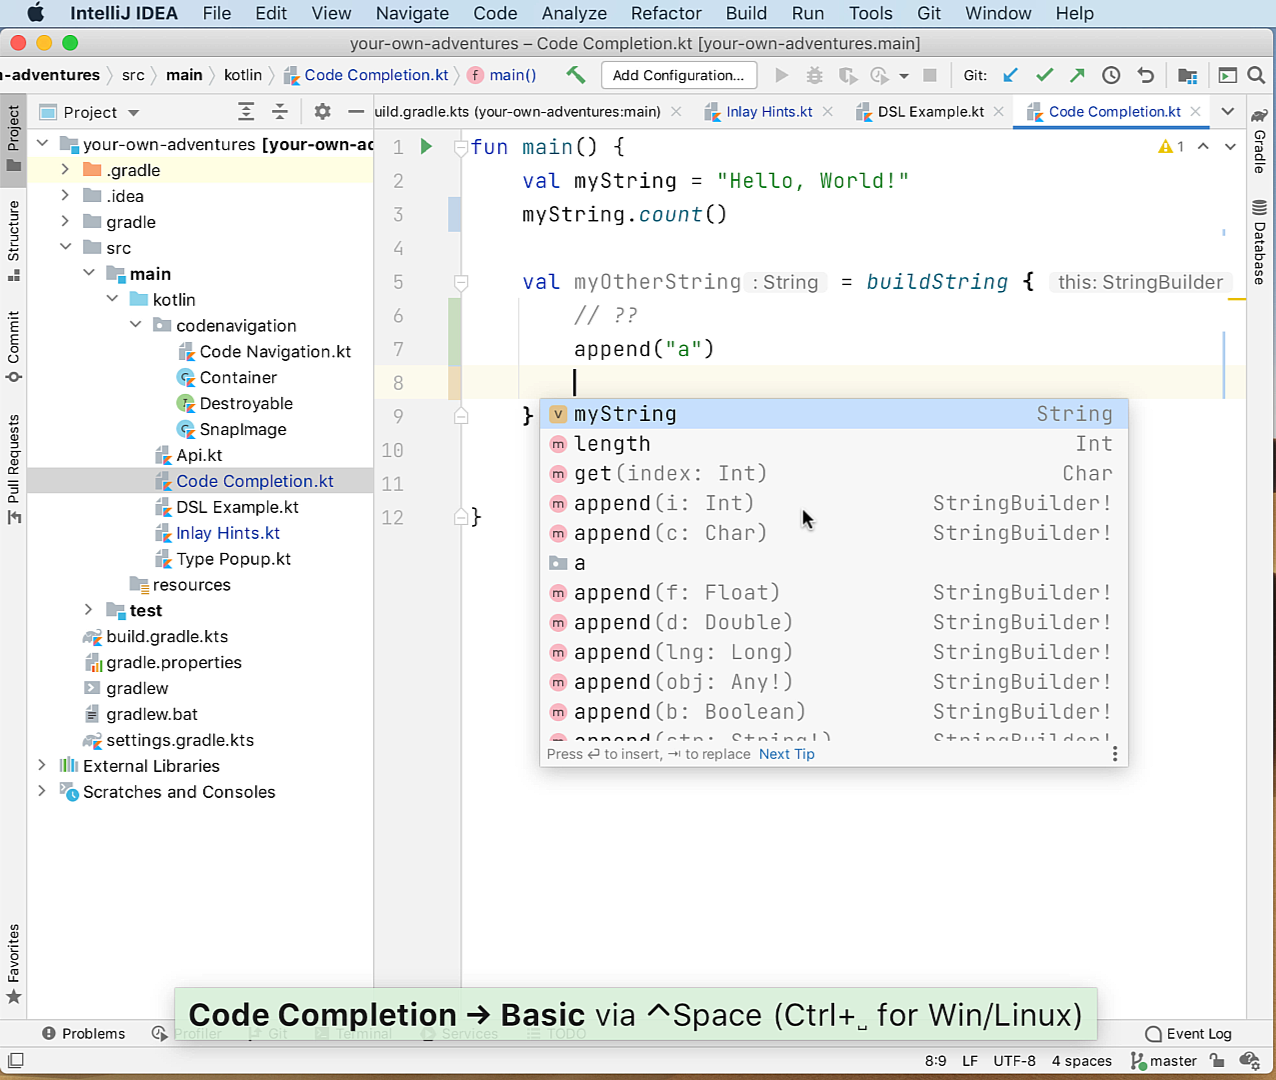
IntelliJ IDEA’s productivity guide tells me I’ve used the feature over 2400 times, and it’s one of the most important tools in the belt.
Parameter info: Type popup (⌘ P)
When we first type out a function with parentheses, we get a little hint bubble that tells us parameters that the function accepts. However, this popup only appears the first time we write those parentheses – when we jump away with our cursor and return to our function later, we might want to see this information again.
To magically summon the parameter info popup again, we simply press ⌘ P (Ctrl P on Win/Linux):
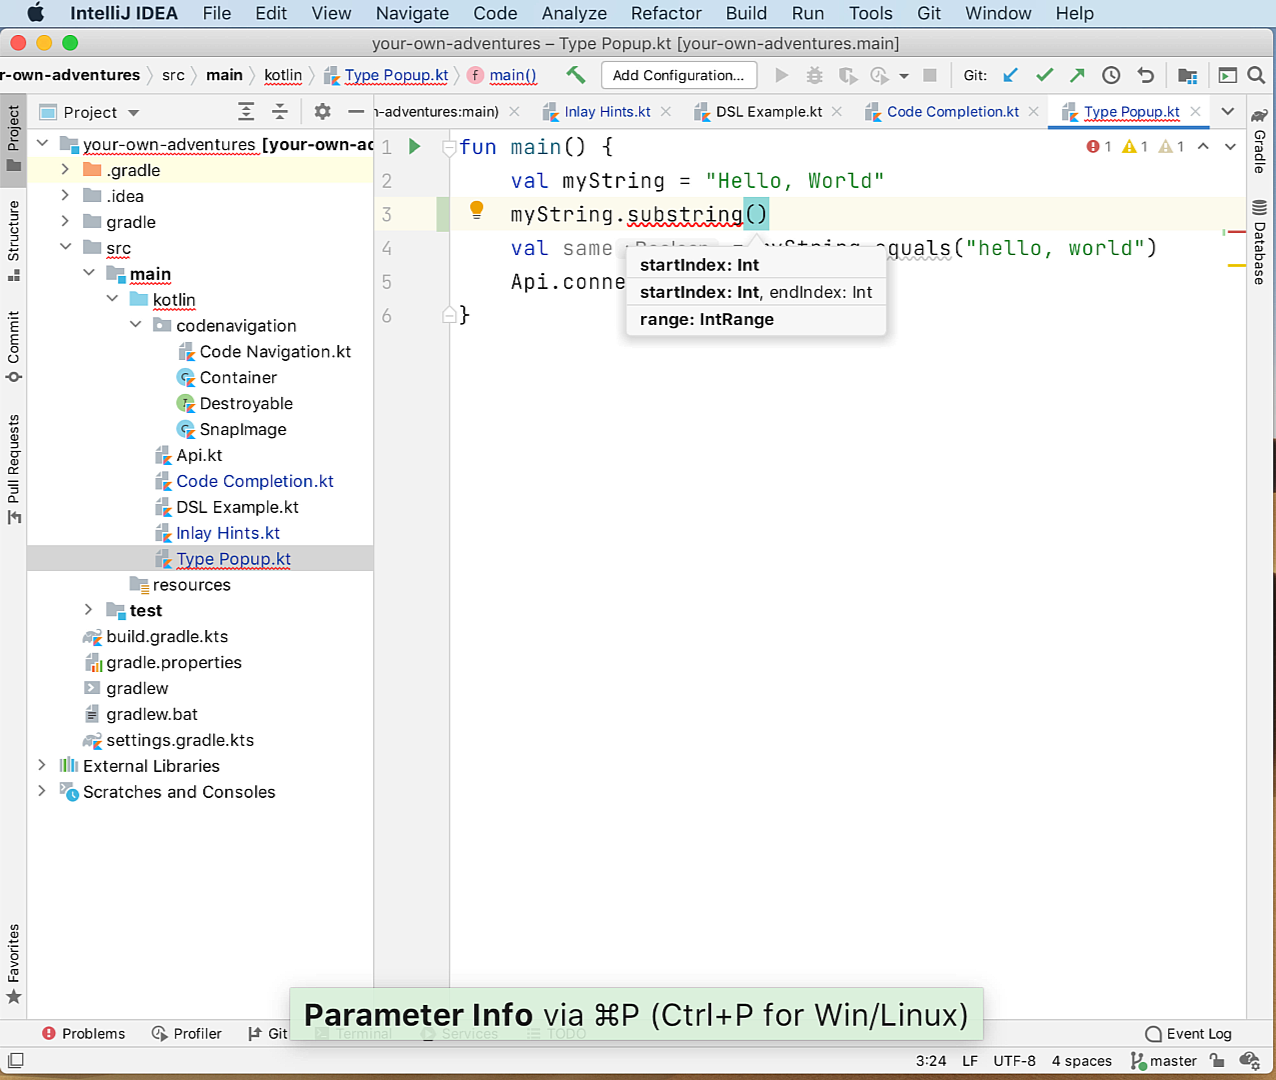
The popup also shows default parameters, overloads & co. As such, it can also help us discover new functionality on already existing code – like additional parameters we might still want to add to adjust the behavior of any functions we call.
Quick Documentation (F1)
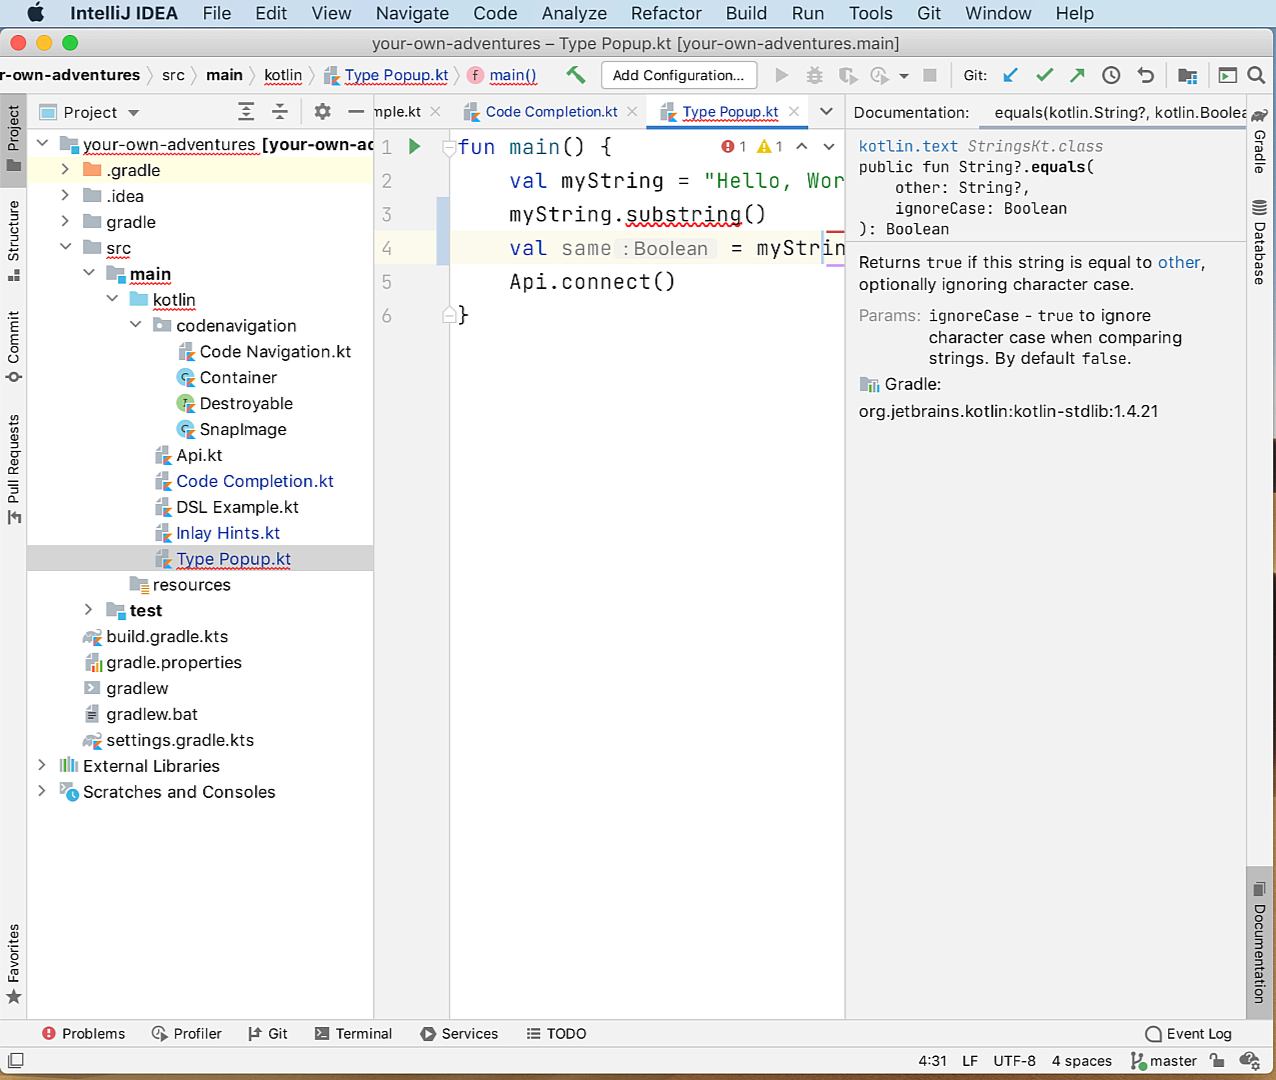
If we hit F1 (Ctrl Q on Win/Linux), IntelliJ IDEA will show us a little text blurb explaining what a method is supposed to do – some quick documentation!
We can actually pin this window to the side of our IDE via the three little dots ⋮ in the pop-over. From there, we can select the option “auto-update from source,” reachable by the small cogwheel icon ⚙️. With this enabled, we always get up-to-date information on the side of our IDE about the symbol the cursor is currently over.
Navigating through code
Your IDE also empowers you when it comes to moving between pieces of code, usages and declarations, and more. Let’s take a closer look!
Go to declaration or usages (⌘ Click / B)
The shortcut ⌘ Click / B (Ctrl Click / B on Win/Linux) is known by its formal title “Go to declaration or usages”. As you may have guessed, it’s a two-way shortcut:
When we click on the usage of a symbol – a variable, a place where we’re constructing a new object, invoking a function, or implementing an interface – this shortcut will send us to the definition of what we just clicked.
And vice-versa, when we click on a symbol declaration – so a place where we’re declaring a variable, an interface, a class, or a function, this is going to give us a list of all places where that symbol is being used in our project.
This shortcut is an easy way to reveal interesting information about our code and the code we depend on. I find stepping into a library especially useful:
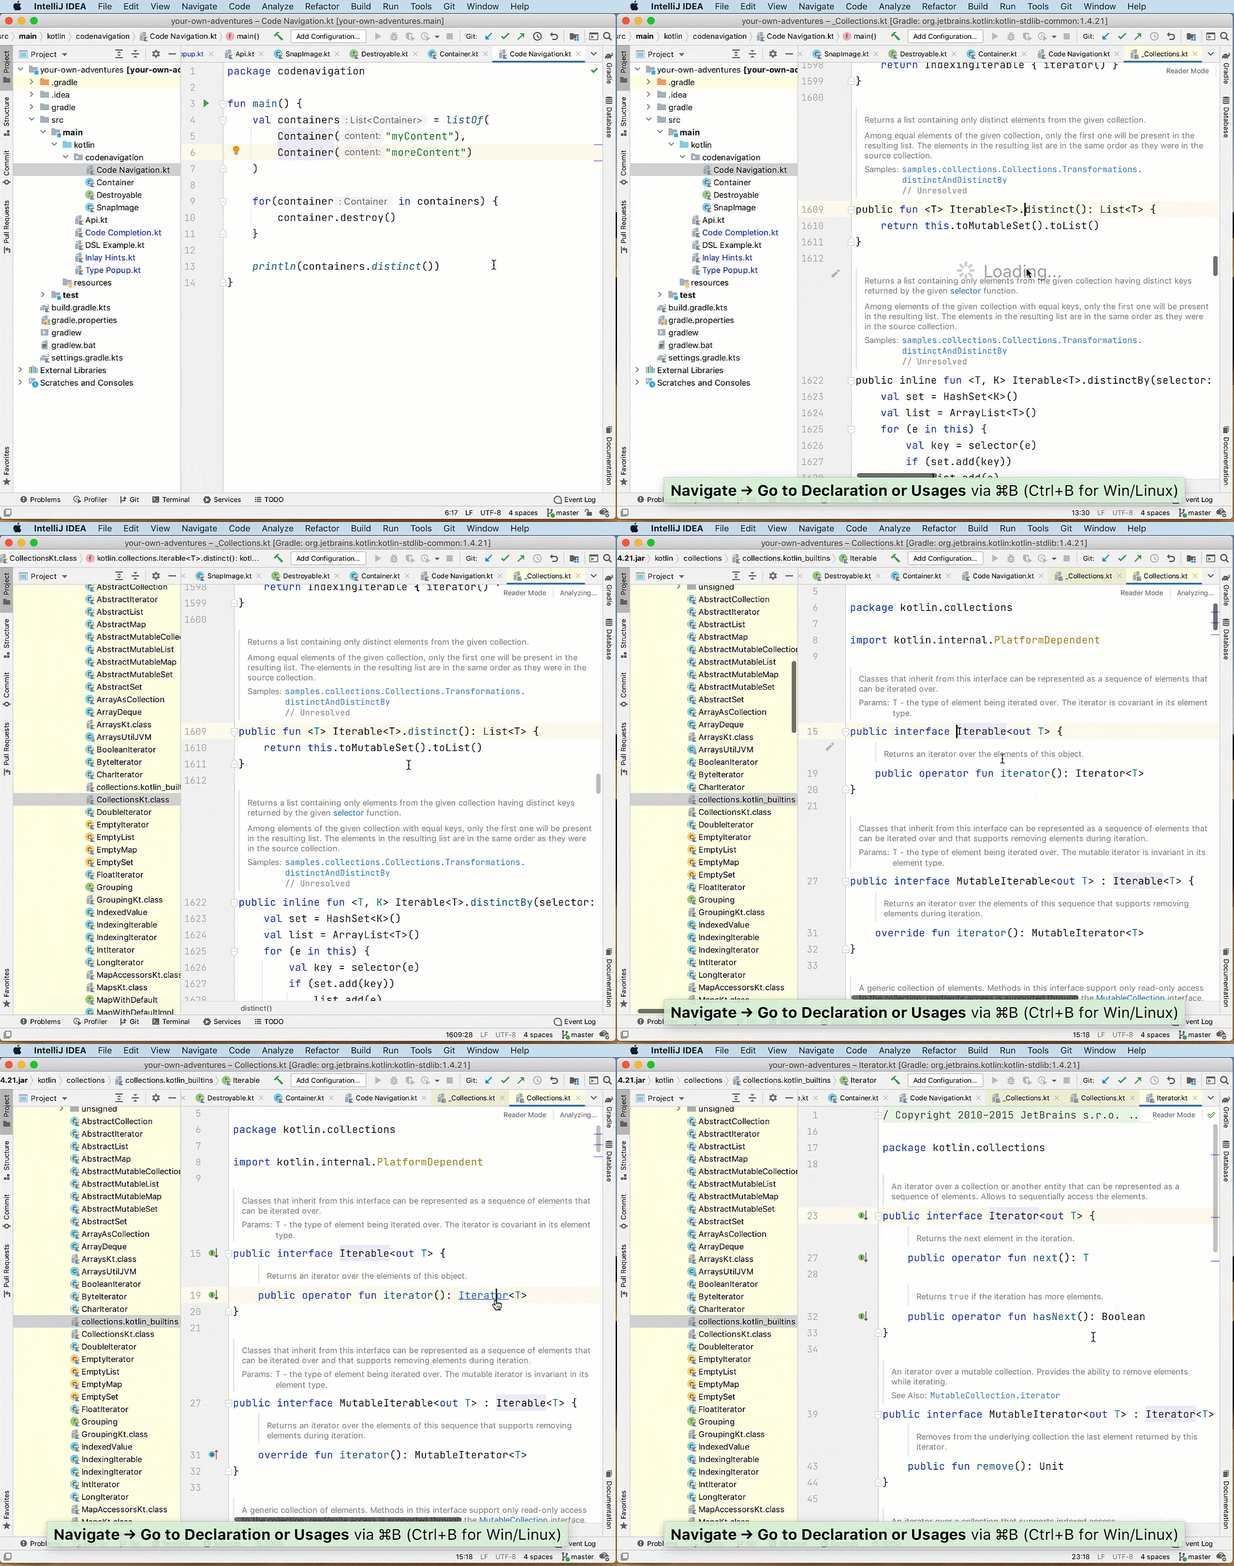
We can look at the code we’re calling, learn something from its implementation and structure, and we can immerse ourselves even deeper.
Rendered documentation
IntelliJ IDEA and Android Studio actually have something called “Rendered documentation”. This makes it more comfortable to read documentation blocks in code by changing the font and making the contrast between code and documentation even stronger.
Structure tool window
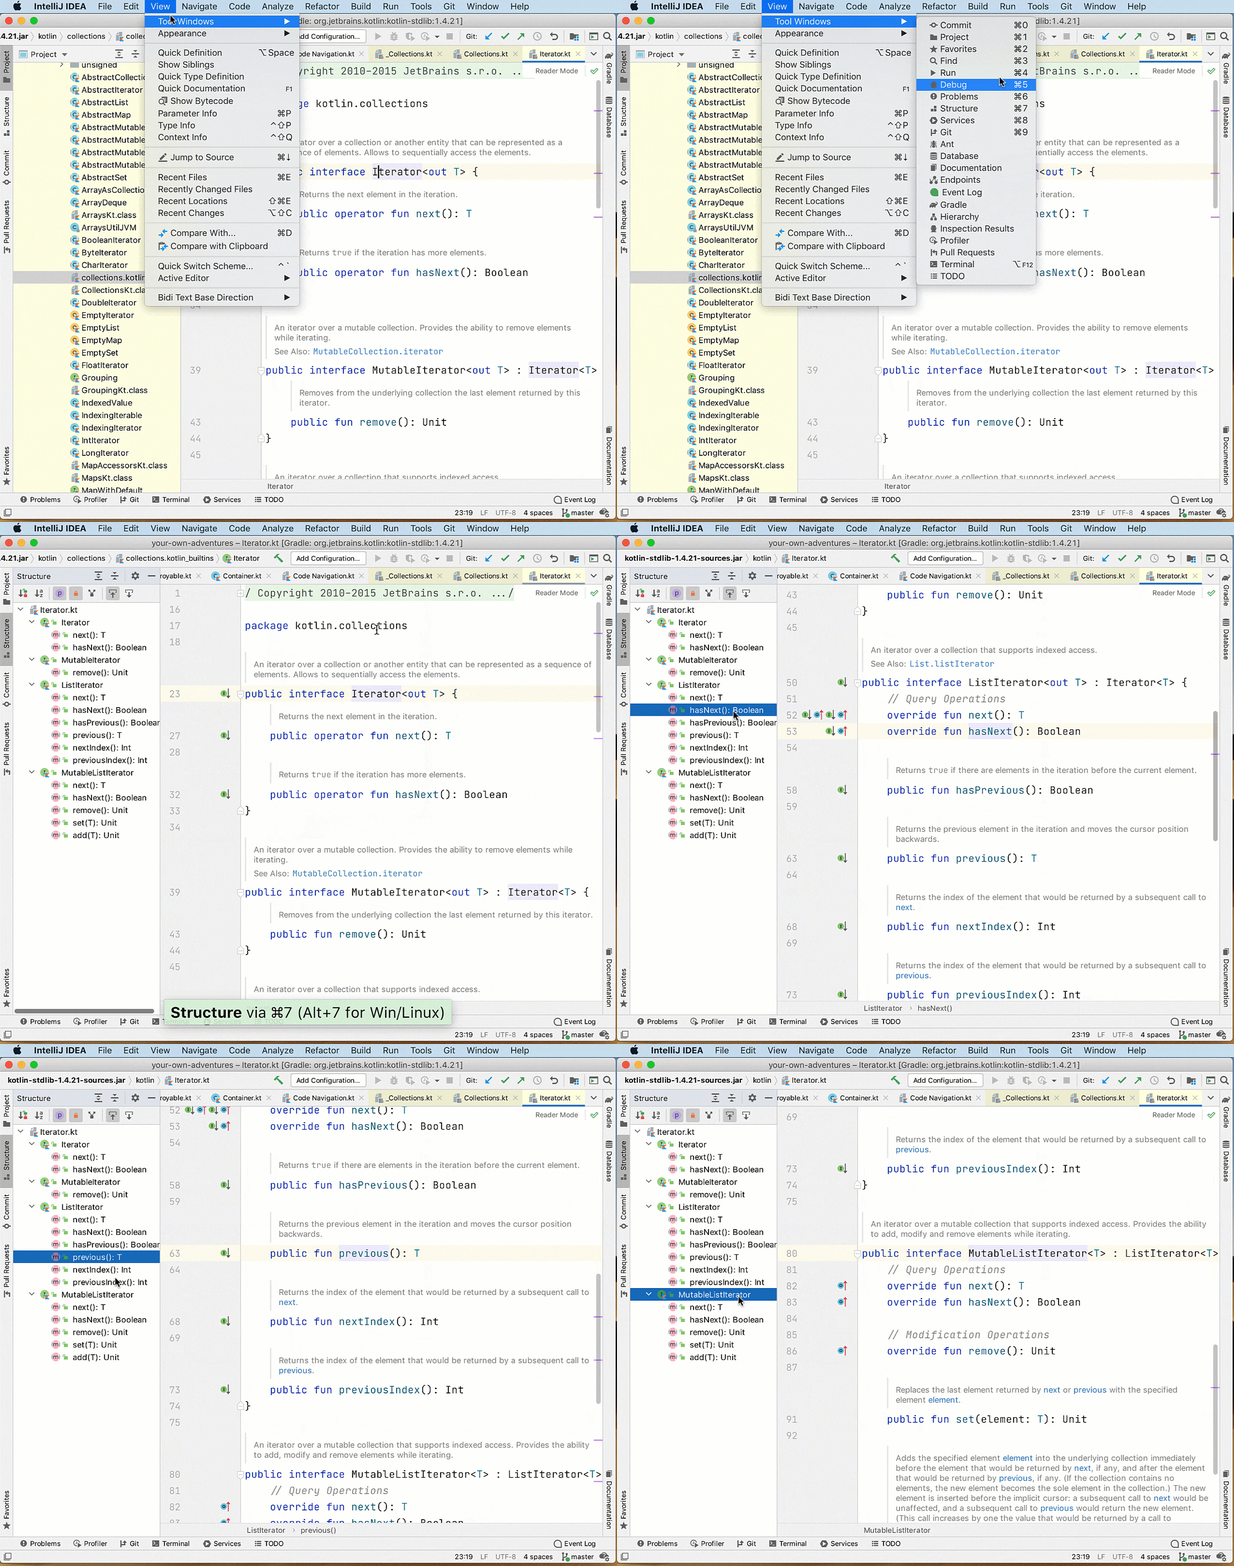
IntelliJ and Android Studio allow us to look at our currently opened file’s structure, which helps us discover interesting parts quicker. We can enable the structure tool window via View > Tool Windows > Structure. This pops open information about the current file, which we can use as a navigation helper.
Searching (and finding)
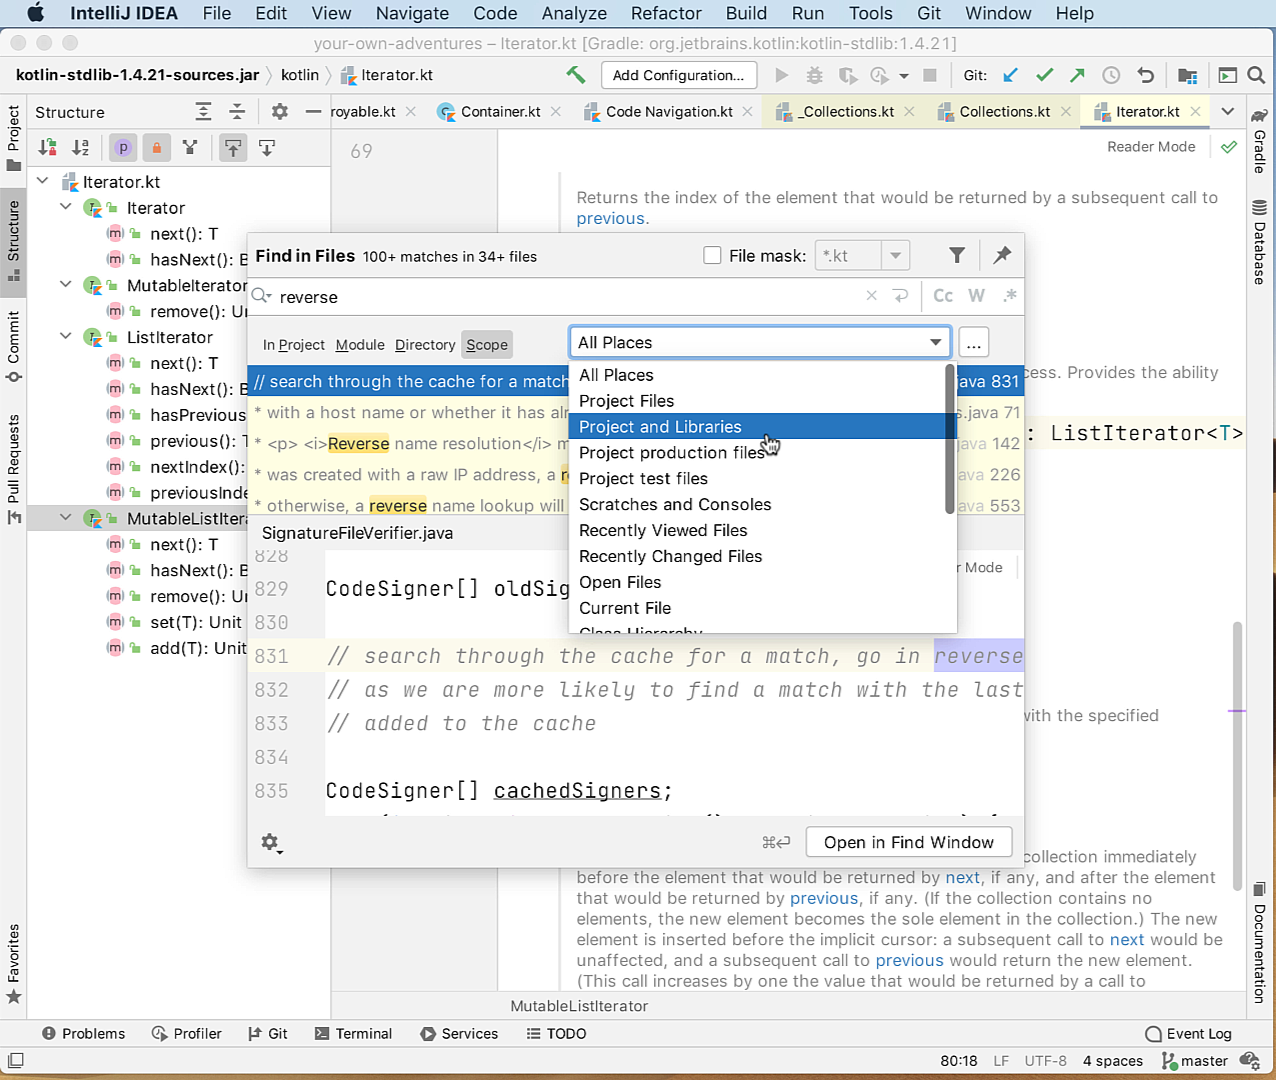
If we can’t find what we’re looking for, we can always go back to the text search function. In IntelliJ IDEA and Android Studio, we can reach “Find in Files” via ⌘ ⇧ F (Ctrl Shift F on Win/Linux).
By default, this function only searches for text occurrences in our own code, not the code of our dependencies. However, we can set our search scope to include “Projects and Libraries” to widen where to look for text snippets.
Structural search
There’s also the so-called structural search, which is a bit of a specialized tool when it comes to exploring. It allows us to find constructs matching a specific schema, for example finding functions that have exactly one parameter.
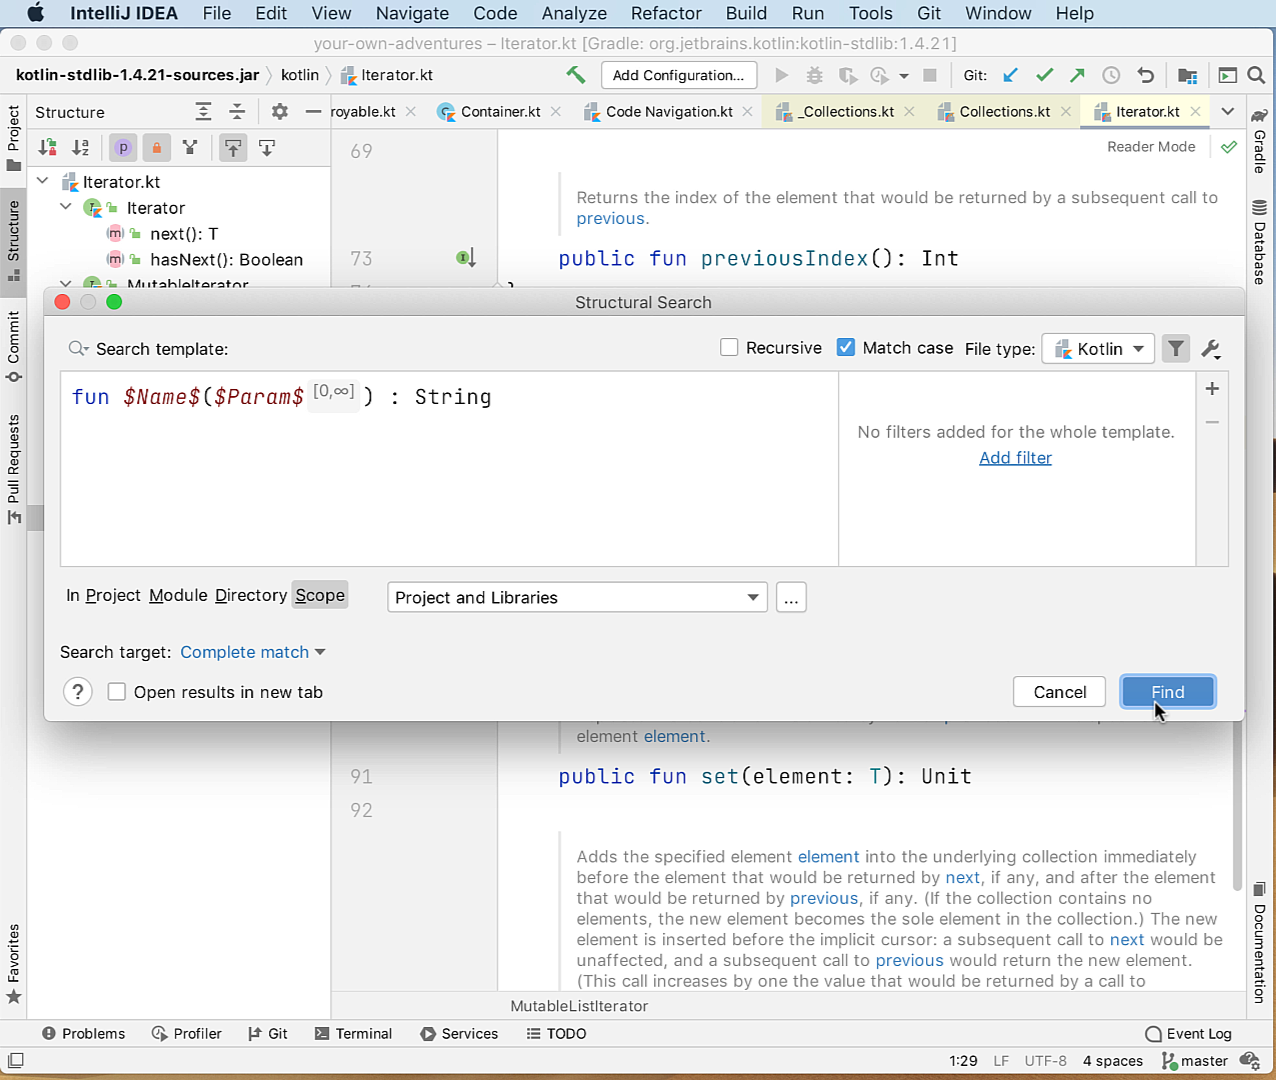
You might not use this one as often. But it’s always good to have heard about the fact that it exists – you never know when that knowledge might come in handy, and then you can look into the topic a bit more deeply.
Go and explore!
I hope you learned something new. If you have some more must-have settings, shortcuts, or whatever, feel free to share them with me, either here, on YouTube, or Twitter.
There are tons of other productivity shortcuts in your Kotlin IDE. If you’re interested in more of them, check out Trisha Gee’s video covering the 15 IntelliJ IDEA shortcuts:
Alternatively (or additionally), grab yourself a virtual keymap overview, which has all the most-used shortcuts for the operating system of your choice!
Try integrating your new knowledge when you work with Kotlin code the next time. Have fun exploring!